Here is a pdf document version of this page.
UMBC Metrics
Annual Bachelor’s degree graduates
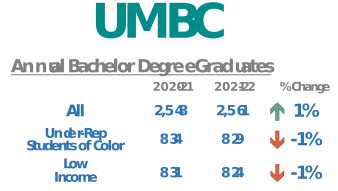
This is the Annual Bachelor’s degree graduates at the University of Maryland, Baltimore County (UMBC) for the 2020-21 and 2021-22 academic years. The data shows a slight increase in overall graduates but a decrease among underrepresented students of color and low-income students.
- Overall Graduates: Increased by 1% from 2,548 in 2020-21 to 2,561 in 2021-22.
- Under Represented Students of Color: Decreased by 1%, from 834 to 829.
- Low Income Students: Decreased by 1%, from 831 to 824.
Graduation Rates for UIA Students
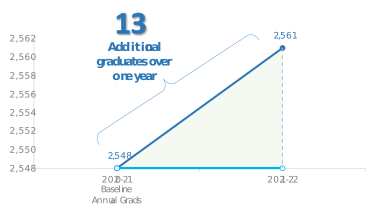
The image displays a data visualization showing an increase in annual graduates from the 2020-21 baseline to the 2021-22 period. The number of graduates increased by 13 over the one-year period.
- Baseline (2020-21): 2,548 graduates
- Following Year (2021-22): 2,561 graduates
- Increase: 13 additional graduates over one year
Freshmen progress, Retention, and Graduation Rates
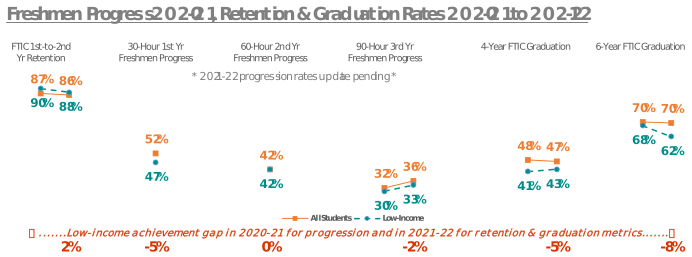
The chart displays freshmen progress, retention, and graduation rates from 2020-21 to 2021-22, comparing “All Students” with “Low-income” students.
- Retention: First-to-second-year retention rates were high for both groups, with a 2% gap in 2020-21.
- Graduation Rates: Six-year graduation rates were identical at 70% for all students and low-income students in 2020-21.
- Achievement Gap: The low-income achievement gap varied across metrics, from a 2% gap in first-year retention to an 8% gap in 6-year graduation rates for 2021-22 metrics.
- Progression: Progression rates for 2021-22 are noted as pending update.